Last mile delivery services: 5 facts for online retailers
A single segment of the shipping chain can consume up to 53% of total delivery cost. It is not the ocean leg. It is not the regional linehaul. It is the short, fragmented movement from local node to customer address.
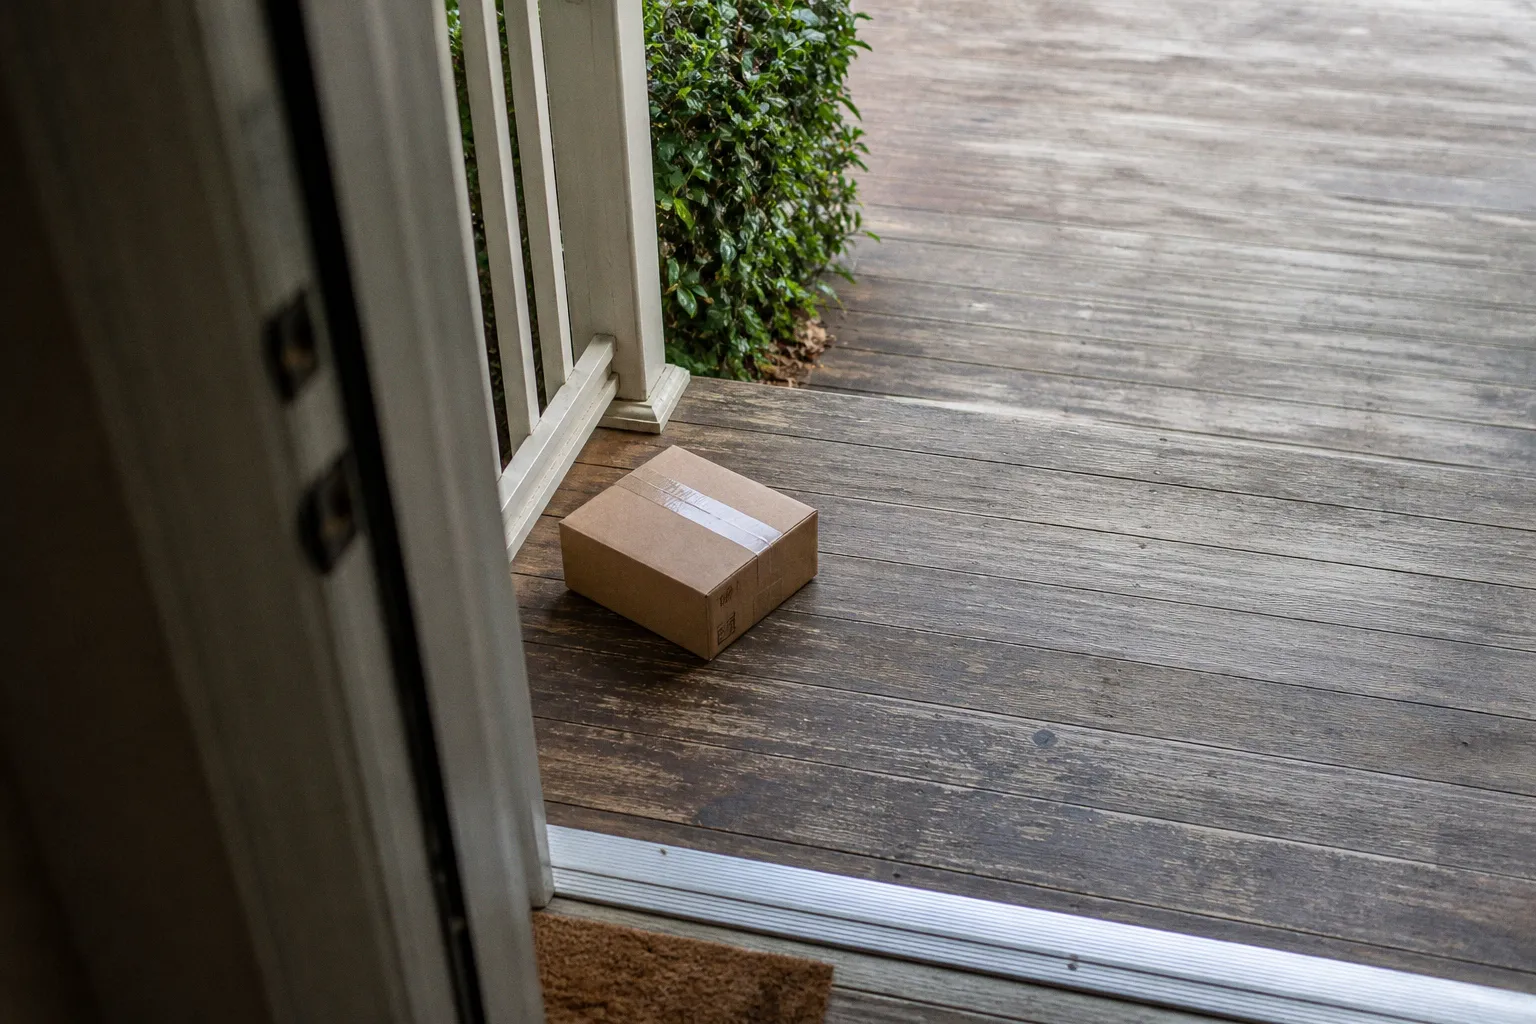
A single segment of the shipping chain can consume up to 53% of total delivery cost. It is not the ocean leg. It is not the regional linehaul. It is the short, fragmented movement from local node to customer address.
That is the operational defect inside many e-commerce P&Ls. Last mile delivery services look like a transportation line item. They behave like a margin compression system. Every failed attempt, address exception, split shipment, return pickup, and “where is my order” ticket adds cost after the sale has already been won.
The retailer sees revenue. The system sees latency, variable density, and unpredictable stop economics.
1. The final mile carries disproportionate financial weight
Last mile delivery is structurally expensive because it has low consolidation efficiency. A parcel moving through the middle mile can ride in dense batches. A last-mile route decomposes that batch into individual stops, individual addresses, individual service windows, and individual customer expectations.
That creates a cost profile with weak linearity.
A carrier can move 5,000 parcels between hubs with predictable throughput. It cannot deliver 5,000 parcels to 5,000 homes with the same mechanical efficiency. Route density becomes the primary variable. Drop time becomes the second. Exception rate becomes the third.
For online retailers, the 53% figure is not an abstract industry statistic. It maps directly to five operational zones:
- Delivery distance from local node. Longer stem distance reduces route utilization before the first successful drop.
- Stop density. Urban routes can concentrate packages. Rural routes spread fixed labor and vehicle cost across fewer deliveries.
- Service-level promise. Two-day, next-day, and same-day promises reduce batching flexibility.
- Failed delivery rate. A second attempt is not a small surcharge. It is duplicate route consumption.
- Packaging and dimensional weight. Oversized cartons degrade vehicle cube utilization and increase carrier billing exposure.
The failure mode is common. A retailer negotiates a lower base shipping rate and misses the total delivered cost. Base rate is visible. Accessorials, failed attempts, residential surcharges, delivery area surcharges, and customer service load are less visible.
The correct unit is not “shipping cost.” The correct unit is net delivery cost per completed order.
That number includes:
1. Carrier charge.
2. Fuel and residential surcharges.
3. Address correction and exception fees.
4. Warehouse labor for packing and manifesting.
5. Customer support contacts generated by delivery ambiguity.
6. Refunds, reships, and appeasement credits.
7. Return shipping and inspection cost where applicable.
A low-cost carrier can become expensive if it increases contacts per 1,000 orders. A premium carrier can become cheaper if it reduces failures on high-AOV shipments. The decision is arithmetic. Not preference.
The last mile is not the end of fulfillment. It is the point where hidden cost becomes measurable damage.
2. Customers now treat visibility as part of the product
Approximately 73% of consumers identify fast and reliable delivery as the most important factor in the online shopping experience. That does not mean every retailer must offer same-day delivery. That claim is operationally false for many categories.
It means the promised delivery profile must be stable, visible, and believable.
More than 80% of customers expect proactive delivery status notifications. That expectation changes system design. Tracking is no longer a passive page buried in an account dashboard. It is an event stream.
The relevant events are not cosmetic. They reduce inbound support demand and payment-risk behavior. A customer who receives deterministic delivery signals is less likely to open a support ticket, file a chargeback, or reorder from a competitor.
A useful tracking architecture has four characteristics:
- Carrier event normalization. “Out for delivery,” “delivery attempted,” and “exception” must map consistently across e-commerce last mile carriers.
- Low notification latency. A status event that arrives six hours late is not visibility. It is historical logging.
- Exception classification. Weather delay, bad address, refused delivery, and inaccessible location require different workflows.
- Customer-facing precision. A vague “in transit” message after the promised date increases contact rate.
The operational benchmark is not whether tracking exists. Most merchants have tracking. The benchmark is whether tracking reduces friction.
A clean event model separates delivery states into actionable buckets:
| Delivery state | System meaning | Retailer action |
|---|---|---|
| Label created | Parcel not yet inducted | Prevent premature “shipped” messaging |
| Carrier received | Possession transferred | Start reliable transit clock |
| In transit | Network movement active | Suppress unnecessary interventions |
| Out for delivery | Local route assigned | Send customer time-window message if available |
| Delivery exception | Promise at risk | Trigger proactive service workflow |
| Delivered | Carrier confirms completion | Close fulfillment loop and start post-delivery sequence |
| Return to sender | Delivery failed or refused | Route to refund, reship, or fraud review logic |
The weak point is usually between order management and carrier data. Retailers often connect a warehouse management system, shipping platform, carrier API, helpdesk, and email/SMS tool without a single event truth layer. The result is duplicate messages, stale tracking pages, and support agents reading different facts than customers.
That is not a communications issue. It is a data synchronization issue.
For last mile delivery services, visibility must be engineered as an operational control surface. It affects customer satisfaction, support cost, refund pressure, and carrier accountability.
3. Market growth is creating more options, not simpler decisions
The global last mile delivery market is projected to expand at a 15% to 20% compound annual growth rate through 2030. High growth attracts new providers, local delivery services for business, crowd-sourced fleets, regional carriers, parcel lockers, and specialized networks for bulky goods.
More providers do not automatically produce better outcomes. They produce a routing problem.
Retailers now face a carrier selection matrix with too many variables for manual rules. A basic “use Carrier A for ground and Carrier B for express” structure is obsolete once order volume, geography, SLA, product type, and customer value are considered.
The primary final mile delivery options usually fall into five categories:
1. National parcel carriers. Strong coverage. Mature tracking. Higher exposure to surcharges and peak constraints.
2. Regional carriers. Better density economics in specific zones. Coverage gaps outside target markets.
3. Local courier networks. Useful for metro delivery and scheduled service. Integration quality varies.
4. 3PL-managed delivery networks. Simplifies merchant operations. Reduces direct carrier control.
5. Store-based or micro-fulfillment delivery. Strong for inventory close to demand. Requires accurate local stock and dispatch logic.
A merchant with one warehouse and light parcels may need a simple national-plus-regional model. A merchant with temperature-sensitive goods, oversized cartons, or high return rates needs different routing logic. The carrier set should follow the order profile.
A basic decision table exposes the trade-offs.
| Option | Best fit | Operational risk | Data requirement |
|---|---|---|---|
| National parcel carrier | Broad geographic coverage | Peak surcharges, residential fees | Standard API tracking and rate shopping |
| Regional carrier | Dense state or metro clusters | Coverage fragmentation | Zone-level carrier performance data |
| Local courier | Same-day or scheduled metro drops | Variable scan discipline | Real-time dispatch and proof of delivery |
| 3PL network | Retailers avoiding direct carrier management | Lower direct control | SLA reporting and exception transparency |
| Parcel locker / pickup point | Failed-delivery reduction | Customer adoption friction | Checkout-level pickup selection logic |
The carrier mix should be recalculated against actual order history. Not against generic market claims.
The useful dataset includes:
- Orders by ZIP or postal code.
- Carton dimensions and billed weight.
- Delivery promise selected at checkout.
- Actual induction timestamp.
- Actual delivery timestamp.
- Exception code frequency.
- Cost per delivered parcel.
- Support contacts tied to tracking or delay.
- Return initiation and return receipt dates.
Once these fields exist, routing can become deterministic. High-value orders can move through carriers with lower exception rates. Low-margin orders can use economy services where delivery latency does not damage conversion or retention. Bulky items can avoid providers with poor dimensional economics.
This is where logistics intersects with capital discipline. Durable operators treat delivery networks like assets with yield, risk, and time horizons; the same logic behind business assets that outlast short-term trends applies when carrier relationships become repeatable infrastructure instead of ad hoc procurement.
Growth in last mile shipping providers will continue. The merchant advantage will not come from adding every provider. It will come from selecting the minimum effective network and measuring it without sentiment.
4. Returns convert delivery cost into margin leakage
Reverse logistics can cost retailers up to 66% of the original product price. That figure is severe because returns carry duplicated movement and additional handling.
A forward shipment has one commercial objective: deliver the item. A return has several possible outcomes:
- Restock as new.
- Restock as open box.
- Refurbish.
- Liquidate.
- Dispose.
- Send to vendor.
- Investigate for fraud or abuse.
Each outcome has a different cost path.
Last-mile returns are especially destructive when retailers treat them as a customer-service afterthought. A free return label may protect conversion, but it also creates uncontrolled inbound freight. A slow inspection process delays resale. A poor reason-code taxonomy hides product defects. A weak disposition workflow turns recoverable inventory into dead stock.
The return process needs the same engineering discipline as outbound delivery.
The return cost stack
The visible return cost is the carrier label. The real stack is larger:
1. Return shipping charge. Paid by merchant, customer, or split through policy.
2. Inbound receiving labor. Warehouse time to identify, scan, and stage the returned unit.
3. Inspection labor. Condition check, completeness check, fraud review.
4. Repackaging. New polybag, box, inserts, labels, or refurbishment materials.
5. Inventory holding time. Capital locked until resale or liquidation.
6. Markdown exposure. Returned seasonal goods lose value quickly.
7. Customer support cost. Refund status contacts rise when return tracking is weak.
8. Payment processing loss. Some fees may not be fully recoverable depending on processor terms.
9. Fraud and abuse. Wardrobing, empty-box returns, and item switching require controls.
A retailer cannot eliminate returns. It can reduce uncontrolled variance.
The best returns programs segment by product economics. A $12 item with high return shipping cost should not follow the same path as a $600 item with strong resale value. A damaged consumable should not move through the same inspection workflow as apparel. A repeat returner should not receive identical policy treatment to a first-time buyer with high lifetime value.
Returns should be routed by rules:
- Keep-it refunds where reverse freight exceeds recoverable value.
- Carrier pickup for bulky or high-value goods.
- Drop-off consolidation for apparel and accessories.
- Inspection-required refunds for fraud-prone categories.
- Instant refund for trusted customers and low-risk SKUs.
- Exchange-first flows where size or variant mismatch dominates.
The last mile matters again because return convenience affects conversion. But convenience without cost control is subsidy. The system must measure return rate by SKU, acquisition channel, customer cohort, fulfillment node, and delivery provider.
A high return rate from one SKU may indicate poor product content. A high damage rate from one carrier may indicate handling or packaging failure. A high “not received” claim rate by region may indicate delivery proof weakness. These are separate problems. Blending them into one returns percentage destroys the signal.
A return is not a reversed sale. It is a second logistics transaction with worse economics and less room for error.
5. Carrier partnerships should be managed as throughput systems
Strategic carrier partnerships are often discussed as rate negotiations. That is too narrow. Rate matters. Throughput, exception handling, scan integrity, billing accuracy, and claims performance matter with equal force.
A last-mile carrier is not just a vendor. It is an external execution layer attached to the retailer’s promise engine. If checkout says “arrives Friday,” the carrier network becomes part of the conversion architecture.
The operational review should focus on measured outputs.
Core carrier metrics should include:
- On-time delivery rate by service level. Aggregate performance hides SLA-specific failures.
- First-attempt success rate. A critical metric for residential, signature, bulky, and high-value deliveries.
- Cost per successful delivery. More useful than base rate or label cost.
- Exception rate per 1,000 parcels. The cleanest signal for operational noise.
- Scan compliance. Missing scans create customer anxiety and support contacts.
- Damage rate. Especially important for fragile, oversized, or premium goods.
- Claims approval cycle time. Slow claims recovery increases working-capital drag.
- Invoice variance. Billed cost should match contracted logic and shipment profile.
- Return cycle time. Days from customer handoff to sellable inventory decision.
The best partnerships also include escalation protocols. Not vague account management. Specific thresholds.
Example:
- If on-time delivery drops below target for two consecutive weekly cohorts, the carrier provides lane-level analysis.
- If scan gaps exceed threshold, the carrier identifies depot or route source.
- If invoice variance exceeds tolerance, billing audit shifts from monthly to weekly.
- If damage rate spikes by SKU class, packaging and carrier handling data are reviewed together.
- If return induction delays exceed target, pickup cadence or drop-off network is adjusted.
This is not bureaucracy. It is control theory applied to fulfillment.
A retailer with sufficient volume can use multi-carrier allocation to create pressure and resilience. But multi-carrier complexity has a cost. Every additional carrier requires integration maintenance, label logic, invoice reconciliation, tracking normalization, and support training.
The correct number of carriers is not the largest number. It is the smallest number that gives acceptable coverage, price, redundancy, and service performance.
Where software actually helps
Order tracking software, shipping platforms, transportation management systems, and warehouse management systems can improve last-mile performance. Only if their roles are clean.
A common systems error is overlap. The OMS decides one thing. The WMS decides another. The shipping platform rate-shops without margin context. The customer notification tool sends messages from stale carrier events. Finance audits invoices after the damage is already absorbed.
A cleaner architecture assigns ownership:
| System layer | Primary job | Failure if misused |
|---|---|---|
| OMS | Order promise, customer record, payment status | Promises dates inventory cannot support |
| WMS | Pick, pack, ship execution | Creates late induction despite good carrier SLA |
| Shipping platform | Carrier selection, label generation, manifesting | Optimizes label rate but ignores total cost |
| Tracking layer | Event normalization and notification logic | Sends conflicting or delayed delivery messages |
| Helpdesk | Exception resolution and customer communication | Handles symptoms without system feedback |
| BI layer | Cost, SLA, return, and cohort analysis | Reports averages that hide route-level defects |
Automation is useful when rules are precise. It is dangerous when rules encode bad assumptions.
A strong routing rule might state:
- Orders above a defined value threshold require carrier with stronger proof-of-delivery performance.
- Parcels above a dimensional weight breakpoint avoid carriers with punitive oversize economics.
- ZIP codes with repeated exception rates shift to an alternate provider.
- Orders promised within two days route only through carriers with proven lane performance.
- Repeat abuse accounts lose instant refund privileges and require inspection.
A weak routing rule states:
- Use the cheapest available carrier.
That rule usually optimizes the wrong metric.
The five operational facts, compressed
Last mile delivery services require executive attention because they sit at the intersection of cost, conversion, retention, and working capital. The numbers are blunt:
- Up to 53% of total shipping cost can sit in the last mile.
- 73% of consumers treat fast and reliable delivery as the dominant online shopping factor.
- More than 80% of customers expect proactive tracking notifications.
- The market is projected to grow at 15% to 20% CAGR through 2030, increasing provider choice and routing complexity.
- Returns can cost up to 66% of the original product price, making reverse logistics a direct margin threat.
Those facts point to one conclusion. Last-mile management is not a procurement exercise. It is a system design problem.
The retailer has two viable operating modes.
Mode one: controlled network. Carrier allocation is data-driven. Tracking events are normalized. Returns are segmented by economics. Cost is measured per successful delivery. Exceptions feed back into routing and packaging logic.
Mode two: uncontrolled expense. Carrier choice is rate-led. Tracking is reactive. Returns are policy-led rather than cost-led. Support absorbs delivery failures. Finance sees the margin damage after the fact.
There is no stable middle state. The final mile either becomes an engineered fulfillment layer or remains a variable tax on growth.